Introducing the Product Analysis Tool (PAT)
PAT yourself on the back when you leverage historical data - with none of the hassle.

What markets should we conduct tastings in? What are the best locations to conduct samplings, based on the day, time, price, and category of our products? How do we best utilize our promotional budget to increase sales? Who are the best agencies we work with?
These requests from alcohol beverage groups are more and more common with the customers we serve. That’s why Network Ninja’s MainEvent team created the Product Analysis Tool (PAT), a solution for spirit, beer, and wine suppliers to gain a thorough understanding of sampling programs based on historical marketplace data.
Customers now have complete knowledge of market and account performance before walking in the door.
PAT Highlights
- Leverage data from 250,000 samplings from over 5,000 products.
- Complete analysis of 3,000 off- and on-premise Texas locations including average, samples, sales, conversion rate and price .
- Measure all outcomes from all activations (sales, quantitative/qualitative data).
- Compare and analyze Agencies/Brands/Labels, Markets/Regions, and Accounts based on outcomes.
How does PAT work?
- We’ve taken over 5,000 products and categorized them into 15 alcohol beverage categories (e.g., Vodka, Bourbon, Hard Seltzer, etc.).
- For every tasting, we track the price of the product(s), category, and store location, along with samples, sales, and conversion rate per product.
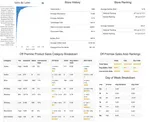
- Analysis is performed for each tasting and store location based on a variety of variables, including price, category, performance in market, and national ranking.
- All results are provided for you to compare, contrast, and determine your tastings on MainEvent Beverage, with similar products.
“The data from the Product Analysis Tool is proving invaluable. We are able to analyze and prioritize top performing tasting locations based on price points and demographics. It also gives us a good idea on how our brand performs vs. others and lets us adjust our scheduling to optimize sales.”

Stephan Godevais, Co-Founder
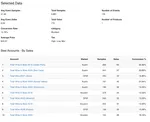
Account Analysis
The solution manages all on- and off-premise locations where activity takes place. Information stored includes store/account details, schedules, and past executions for every account.
- Detailed analysis based on completed visits
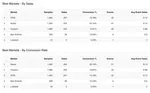
- Statistics include sales per label, brand by account vs. average by market and nationally, average attendance, samples, conversion rate, bottles sold, and price details, along with the breakdown of activity based on the day of the week
- Sales integration option to show the impact executions have on sales at an account level
Make Data-Driven Decisions
Stop presuming what the best markets, locations, days and times are to sample your products based on past assumptions. Instead, leverage relevant data from PAT in MainEvent to confidently direct your team on the best way to spend promotional dollars and allocate your resources.
If you want to see the new Product Analysis Tool (PAT) in action, hit us up.